Score Visualization
See your score's dynamic arc — measure by measure.
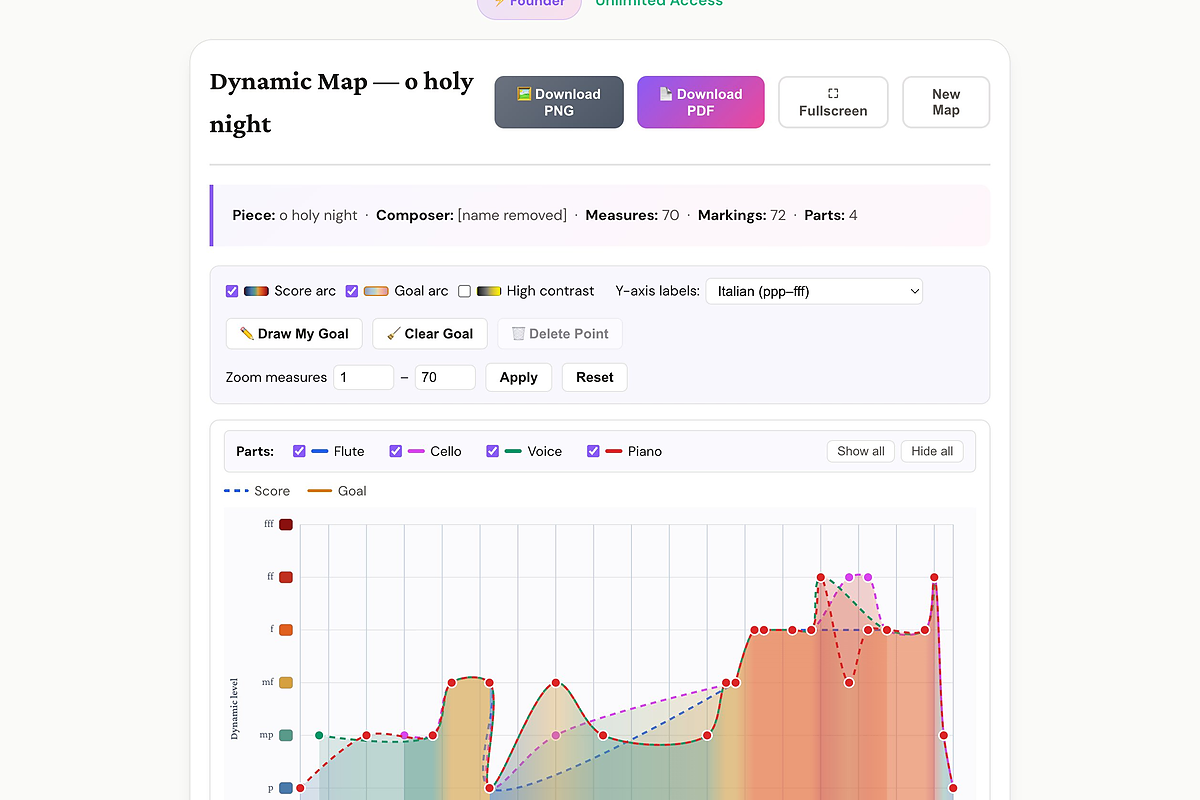
Upload a score and MusEdLab plots every dynamic marking — from ppp to fff — across the full piece on an interactive grid. See the expressive shape at a glance, draw your teaching-goal arc on top, and use the map to plan exactly where to focus your rehearsal energy.
Free to start. No credit card required.
What you get
-
Every marking plotted ppp through fff — every dynamic in the score is identified and placed by measure.
-
Draw your goal arc Sketch your own interpretive arc on top of the score's markings to see where they align and where they don't.
-
Multi-part view Filter by individual voice or instrument part to see how dynamics differ across the ensemble.
-
High-contrast mode Colorblind-accessible display option for classroom projection.
-
Download as PNG or PDF Export the map for your score study folder or to share with section leaders.
-
Works with any ensemble Choir, band, orchestra, chamber ensemble — any PDF score.
What the output looks like